Does GDP growth, or the business cycle, influence bank profitability? And if so, how significant is its impact? In this blog post, we explore these questions using the Significant Bank Database. To uncover the relationship, we apply Ordinary Least Squares (OLS) estimators with fixed bank effects.

Before diving into regression analysis, let’s examine a figure that illustrates the relationship between bank profitability, as measured by Return on Assets (ROA), and GDP growth. The GDP growth variable shows notable extremes: the highest GDP growth rate (24.5%) belongs to Ireland in 2015. However, this figure doesn’t reflect actual economic growth. Instead, it’s inflated by the relocation of intellectual properties (e.g., patents) by multinational corporations seeking tax advantages. The lowest GDP growth rates (-14.2% to -14.8%) come from Lithuania and Estonia during the Great Financial Crisis (in this case, the year 2009). Surprisingly, these values are lower than those observed during the COVID-19 crisis. Nonetheless, the figure reveals a clear positive relationship between bank profitability and the business cycle: as GDP growth increases, bank profitability improves. However, there are exceptions to this pattern.
We proceed by running a regression to explain the ROA variable. The independent variables include CAMEL indicators, which measure capitalization, asset quality, management quality, earnings, and liquidity. However, we replace the earnings variable with the logarithm of total assets, as earnings serve as the dependent variable. Management quality is proxied by the cost-to-income ratio, and liquidity is represented by the cash-to-total assets ratio.
All ratios are expressed as percentages, and GDP growth is the key variable of interest. The regression also includes year dummies to account for time-specific effects. To ensure robustness, standard errors are adjusted for heteroskedasticity, and overlapping ownership structures are excluded using a pre-defined dummy variable.
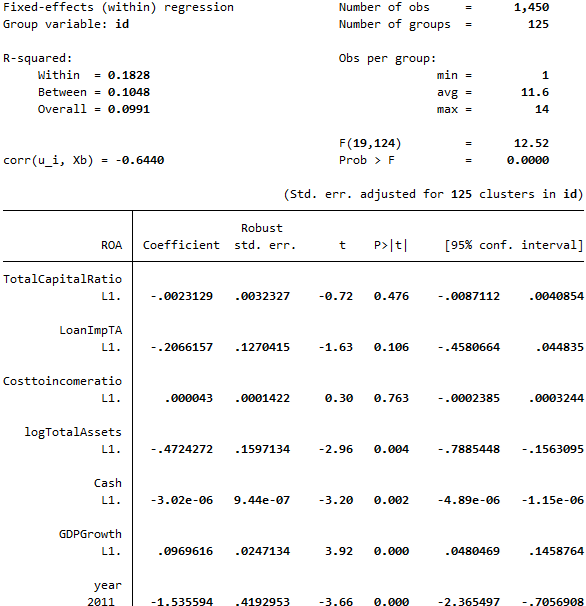
The analysis confirms a significant relationship between GDP growth and bank profitability. The coefficient for GDP growth is 0.1 percentage points, indicating that a one-standard-deviation increase in GDP growth (approximately 4 percentage points) boosts ROA by 0.4 percentage points. Considering that the mean ROA in the sample is 0.47, this finding underscores the substantial impact of GDP growth on bank profitability.
Additionally, some control variables show statistical significance. Larger banks tend to be less profitable than smaller banks, on average. Moreover, a high cash buffer reduces profitability. This is unsurprising because (a) cash does not generate returns, and (b) central banks, including the ECB, imposed negative deposit rates during many sample years, effectively charging banks for holding cash.
The results may be influenced by outliers in the regression variables. A straightforward way to address this issue is to exclude observations below the 1st percentile and above the 99th percentile for each ratio. Additionally, the current specification does not include the lagged dependent variable to account for the persistence of profitability. To address the latter, the regression should use the system GMM estimators. However, we leave this exploration for future posts!

